# Code source: Gaël Varoquaux
# Modified for documentation by Jaques Grobler
# License: BSD 3 clause
코드 소스와 저작권은 위와 같음을 밝힙니다.
import numpy as np
import matplotlib.pyplot as plt

from sklearn import linear_model
필요한 모듈을 가져옵니다.
X_train = np.c_[.5, 1].T
y_train = [.5, 1]
X_test = np.c_[0, 2].T
X_train, y_train, X_test에 해당하는 데이터를 만들어줍니다.
np.c_[.5, 1]
1 X 2 행렬을 만들고
np.c_[.5, 1].T
2 X 1 행렬로 전치해줍니다.
y_train은 일반 리스트로 만들었고, X_test는 X_train과 똑같이 해줬습니다.
np.random.seed(0)
np.random.seed(0)로 매번 같은 난수가 나오게끔 설정합니다.
classifiers = dict(ols=linear_model.LinearRegression(),
                   ridge=linear_model.Ridge(alpha=.1))

for name, clf in classifiers.items():
    fig, ax = plt.subplots(figsize=(4, 3))

    for _ in range(6):
        this_X = .1 * np.random.normal(size=(2, 1)) + X_train
        clf.fit(this_X, y_train)

        ax.plot(X_test, clf.predict(X_test), color='gray')
        ax.scatter(this_X, y_train, s=3, c='gray', marker='o', zorder=10)

    clf.fit(X_train, y_train)
    ax.plot(X_test, clf.predict(X_test), linewidth=2, color='blue')
    ax.scatter(X_train, y_train, s=30, c='red', marker='+', zorder=10)

    ax.set_title(name)
    ax.set_xlim(0, 2)
    ax.set_ylim((0, 1.6))
    ax.set_xlabel('X')
    ax.set_ylabel('y')

    fig.tight_layout()

plt.show()
후반부의 for문과 그래프를 살펴보면
classifiers = dict(ols=linear_model.LinearRegression(),
                   ridge=linear_model.Ridge(alpha=.1))
classifiers
classifiers를 dict 타입으로 만들어줍니다. Key는 'ols', 'ridge'가 되고 모형이 Value가 됩니다.
for name, clf in classifiers.items():
    fig, ax = plt.subplots(figsize=(4, 3))
items 함수는 Key와 Value의 쌍을 튜플로 묶은 값을 dict_items 객체로 돌려줍니다.
(name, clf) 형태이고 예를 들면 (ols, 모델)이 될 것입니다.
plt.subplots은 한 화면에 여러 그래프를 나눠서 그려줍니다. 별도의 옵션으로 사이즈를 지정해줬습니다.
for _ in range(6):
        this_X = .1 * np.random.normal(size=(2, 1)) + X_train
        clf.fit(this_X, y_train)

        ax.plot(X_test, clf.predict(X_test), color='gray')
        ax.scatter(this_X, y_train, s=3, c='gray', marker='o', zorder=10)
range(6)므로 0~5 5번을 반복하게 됩니다.
np.random.normal로 정규분포에 해당하는 값을 2 X 1 행렬로 임의로 추출해 0.01을 곱한 후 X_train을 더한 값을 this_X라 설정합니다(행렬 크기가 맞으므로 덧셈이 가능합니다).
this_X와 y_train으로 모델을 적합한 후
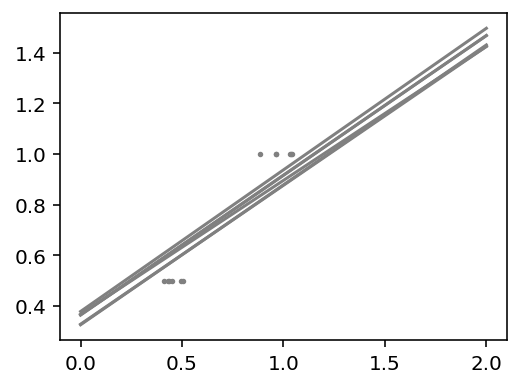
ax.plot로 line 그래프를, ax.scatter로 산점도를 그려줍니다.
ax.plot은 x 값을 X_test, y 값을 clf.predict(X_test)로 하고 색깔을 회색으로 칠해줍니다.
ax.scatter는 x 값을 this_X, y 값을 y_train, 사이즈를 3, 회색, 표시는 동그라미, zorder로 숫자가 클수록 바깥에 보이도록 설정합니다.
clf.fit(X_train, y_train)
    ax.plot(X_test, clf.predict(X_test), linewidth=2, color='blue')
    ax.scatter(X_train, y_train, s=30, c='red', marker='+', zorder=10)

    ax.set_title(name)
    ax.set_xlim(0, 2)
    ax.set_ylim((0, 1.6))
    ax.set_xlabel('X')
    ax.set_ylabel('y')

    fig.tight_layout()
회색으로 된 그래프를 그려준 후
원래 데이터인 X_train, y_train에 모델을 적합시킵니다.
그다음 ax.plot로 line 그래프를 ax.scatter로 산점도를
as.set_title로 제목을, set_xlim으로 x축 범위를, set-ylim으로 y축 범위를, set_xlabel로 x축 이름을, set_ylabel로 y축 이름을 설정합니다.
마지막으로 fig.tight_layout()을 통해 그래프를 데이터에 맞게 깔끔하게 해 줍니다.
plt.show()


최종 그래프는 그림4, 그림5와 같다. Ridge의 분산이 OLS보다 작은 것을 그래프를 통해 볼 수 있습니다.
코드 원문 링크를 첨부합니다.
Ordinary Least Squares and Ridge Regression Variance — scikit-learn 0.21.3 documentation
Note Click here to download the full example code Ordinary Least Squares and Ridge Regression Variance Due to the few points in each dimension and the straight line that linear regression uses to follow these points as well as it can, noise on the observat
scikit-learn.org
'scikit-learn' 카테고리의 다른 글
| Scikit-Learn(사이킷런) 코드 완벽 분석 - Linear Regression csv 파일 이용하기 (0) | 2019.10.24 |
|---|---|
| Scikit-Learn(사이킷런) 코드 완벽 분석 - Tree Regression (1) | 2019.10.22 |
| Scikit-Learn(사이킷런) 코드 완벽 분석 - Linear Regression Lasso (0) | 2019.10.18 |
| Scikit-Learn(사이킷런) 코드 완벽 분석 - Linear Regression Ridge (0) | 2019.10.16 |
| Scikit-Learn(사이킷런) 코드 완벽 분석 - Linear Regression 내장 데이터셋 (0) | 2019.10.16 |


댓글